

bitcoin has no detectable cycles in daily data
a frequency analysis

I ran a spectral analysis of Bitcoin using two years of daily log-return data. The goal was to identify whether the BTC/USD market exhibits any periodic structure: recurring rhythms, dominant cycles, or predictable frequency bands at the daily resolution.
the frequency-domain result
The global power spectral density (PSD) shows that 95% of the signal’s total energy resides below:
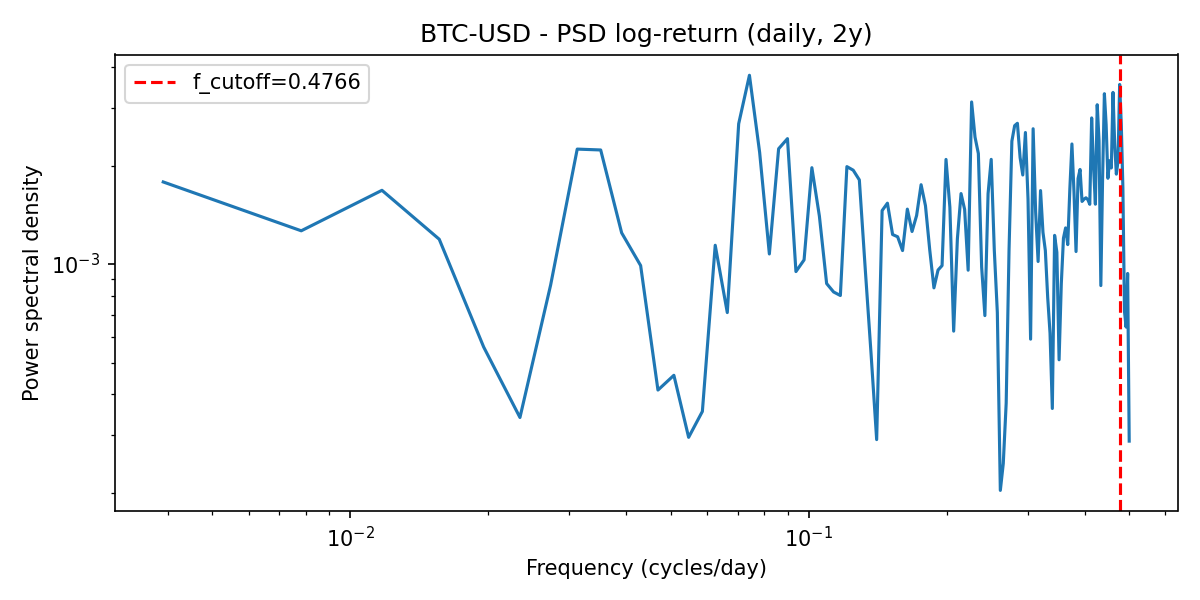
This corresponds to oscillations with periods longer than roughly:
In other words:
Bitcoin’s daily movements are almost entirely driven by slow, multi-day dynamics.
There is no meaningful high-frequency structure in daily data.
implication for sampling rates
Using the cutoff frequency, the Nyquist criterion gives an optimal sampling interval of:
Which leads to a practical conclusion:
Daily sampling (1 point every 24 hours) captures almost all meaningful structure contained in daily log-returns.
Finer sampling does not reveal additional “signal” at this scale; it only increases noise relative to trend.
what the spectrogram shows
Using sliding windows of 128 days, the spectrogram displays how spectral power evolves over time.
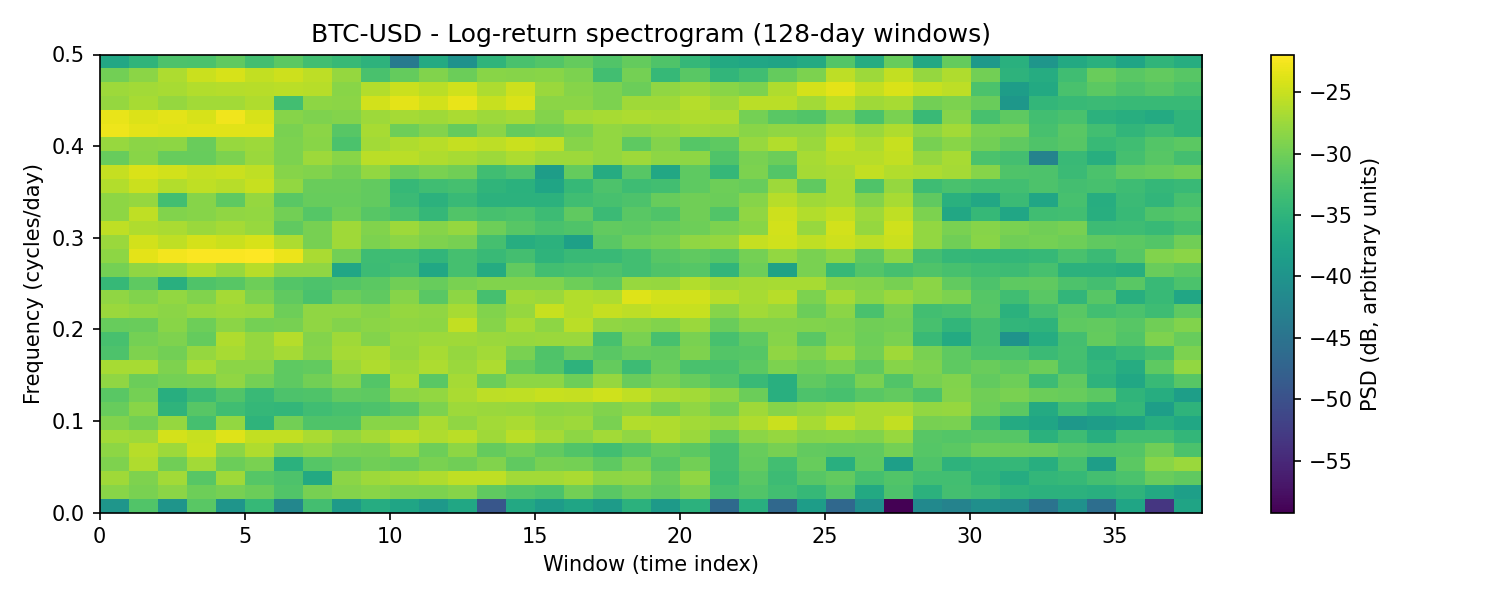
The key observation:
There are no stable spectral bands.
No persistent cycles.
No consistent periodic structure.
Instead, the heat map shows diffuse, shifting power which is typical of a stochastic process with volatility regimes, rather than a cyclical one. The “structure” in Bitcoin’s daily behavior comes from changes in volatility and trend, not from oscillatory components.
why this matters
Many trading narratives implicitly assume cycles:
“monthly rhythm”
“weekly tendency”
“3-day rotation”
“cross-market heartbeat”
But frequency analysis cuts through intuition and directly inspects the structure of the data.
The conclusion here is unambiguous:
At daily resolution, Bitcoin behaves as a non-periodic, noise-dominated process with slow volatility regimes.
what we cannot see with daily data
Daily sampling inherently limits the observable frequency band to:
Meaning:
anything faster than one cycle per day
any intraday periodicity
microstructure oscillations
liquidity cycles
exchange-specific flows
are all aliased and therefore invisible.
To explore whether Bitcoin exhibits meaningful intraday frequency structure, we need higher-granularity data. semn.ai aims to uncover this data in its vizualization terminal and provide an almost continuous sampling process.
final takeaway
The data shows:
no cycles at daily resolution,
no persistent frequencies,
no resonant behavior,
only slow regimes and noise.
Daily data is excellent for capturing long-term drift and volatility shifts, but useless for detecting cyclical behavior. For micro-structure and a hidden peek into real-time market moving forces I am building semn.ai, which uncovers the heartbeat of bitcoin, without candles and beyond noise.
Waitlist is open for a limited time and taking applications for early access.